Feature engineering involves preparing a given dataset such that it is suitable to be fed into a
machine learning model.
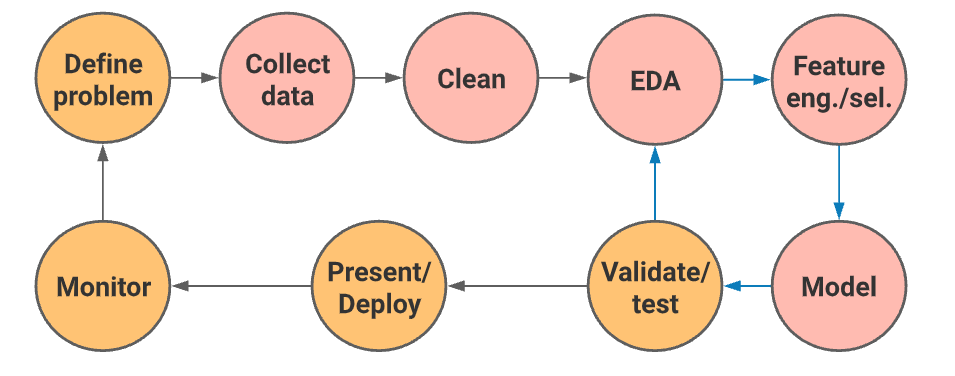
While there are many variations of the data science pipeline depending on the requirements,
feature engineering usually sits
between the exploratory data analysis step and the modelling step.
Ideally, the processed data has been sufficiently analyzed to give the analyst an idea of the
transformations to be applied such that:
The machine learning model is able to ingest the resulting dataset
The model fits the dataset reasonably well
The resulting dataset remains representative of real world phenomena
The word ideally is used here as in reality, there is a significant amount of trial and error
involved in the process, and the analyst will find
himself/herself iterative through the processing, feature engineering and modelling steps within the
pipeline as shown in the workflow above.
Why do feature engineering
The main reasons ultimately lead back to the "why" of feature engineering and can be summarized as follows.
The first 2 are fairly straight forward, and usually requires a more fixed set of steps to achieve.
The last one however, is a little more involved and where most of the discussion will revolve around.
To get data into the "right" format
To ensure that the data is representative of real world phenomena
To "help" the model perform better
Though at this point, we've theoretically gotten the data into a usable state, where (for
example):
Missing values have been imputed
Duplicated values have been removed
Column formats have been configured correctly
Aligned naming conventions and typos
Analyzed and removed outliers
and many others...
Our dataset may not be in the optimal condition for the modelling, but what does this mean?
Explore graphing bowl
WIDGET here, maybe add the polar coords one?
Note that in reality, one would not be able to easily visualize the feature set's relationship with
the response as most
datasets span more than 2 features, or in otherwords span more than 3-dimensions, which would be
rather troublesome to graph meaningfully.
In essence, we're trying to stretch, twist, rotate and transform our dataset into a form that makes
it easier to fit whatever kind of "line" we're trying
to impose on it.
Feature Engineering Techniques
Scaling
Scaling of data is always a good habit in general. However, one must understand why we scale and
how to choose between the different
scaling methods to get the best performance out of a selected model. In very simple terms,
we do scaling because of 2 main reasons.
We do not want
a change in the value of a feature to impact model results drastically just because of its
large magnitude
We want our features to follow some kind of distribution
INSERT EXAMPLE HERE??
We essentially need to scale data for algorithms that require any calculation of distance within
its steps.
A machine learning algorithm does not understand the concept of units of measure when trying to
learn. What this means is that a value of 10 kilograms means exactly the same thing numerically
as 10 cents when put into
the same dataframe before training. Now, imagine our model is in the midst of training, and it
is now at the step of
calculating the error between a predicted 9c and the 10c in the response caused by a change of
weight from 9kg to 10kg.
So we can obviously infer that (keeping all else constant), a change in X of 1 causes a change
in Y of 1.
Now, if we had our initial weights in grams instead of kilograms, this would drastically change
the statement we are making.
We'd be saying now that an increase in X of 1000, causes an increase in Y of 1. If we were to
change X by 1 now, it would seem
alot less effective than it is in the first setting wouldn't it? However, we as humans know that
this is not the case and
we can attempt to communicate this through the scaling of features in our dataset. Also, which
is larger,
10kg or 9c? The more important question is who cares? Scale the data and that problem goes away.
We ultimately
want to get to a point where we can say statements like "feature \(X_1\) is more important than
\(X_2\)",
and having it make some sense.
Algorithms that rely on scaling
K-NN and K-Means for normalizing euclidean distance calculations
PCA for normalizing variance calculations
Neural networks for faster convergence
Regularization
Algorithms that do not rely on scaling, rely on rules
Tree-based models
Linear regression using the normal equation
Algorithms that have built-in functionality to handle scaling
Naive Bayes (go through maths briefly)
Linear Discriminant Analysis
Popular Scaling Techniques
Standard Scaler
Min Mix Scaler
Log Scaler
Other Scaling Techniques
Max Absoulate Scaler
Robust Scaler
Quantile Transformer
Unit Vector Scaler
INSERT WIDGET ON SCALERS HERE
Variable Encoding
Machine learning models can only ingest numerical values.
Binning
Higher order features + interactions
Creating high-order features or multiplying feature values together may seem unintuitive or make
little sense, but this is best explained with an interactive widget. If we wanted to create a
model to separate the orange and blue points,
sure we can use a more complex non-linear model, but before jumping ahead, let's see what
happens to the shape of our data when we try
to add a 3rd feature column to it. Try the different options and see which techniques end up
being useful to allow us to separate the
2 categories even with a linear model.